Introduction
The purpose of this lab was to become familiar with using LiDAR (light detection and radar) data for remote sensing applications. Using ERDAS Imagine and ArcMap to visualize the point cloud information.
Methods
Using a folder containing 40 lidar data files, the quarter section tile data was brought into ERDAS Imagine to visualize them as point cloud data. The files were exported to a project folder as
.las (point cloud tiles) files.
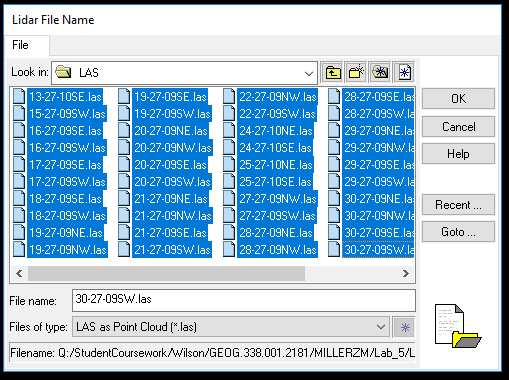 |
| Figure 1: Add .las files to ERDAS Imagine. |
Once the files
LAS as Point Cloud files were saved, an
LAS Dataset was created in ArcMap. This was done by adding the point cloud files to the LAS dataset prompt and calculating statistics about the data comprising the files.
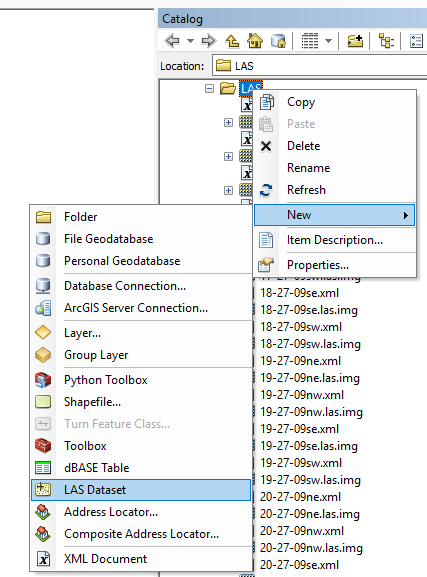 |
| Figure 2: Create new LAS dataset in ArcMap. |
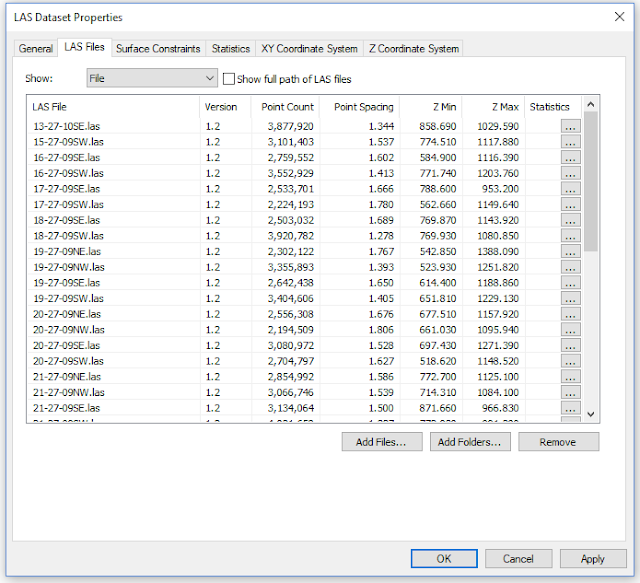 |
| Figure 3: Add files to LAS dataset in ArcMap. |
This calculation returned information regarding the highest and lowest Z-values (elevation) of the study area's returns, and classified the return values. The dataset was projected into a
horizontal and
vertical coordinate system since the point cloud data contained X,Y, and Z coordinates.
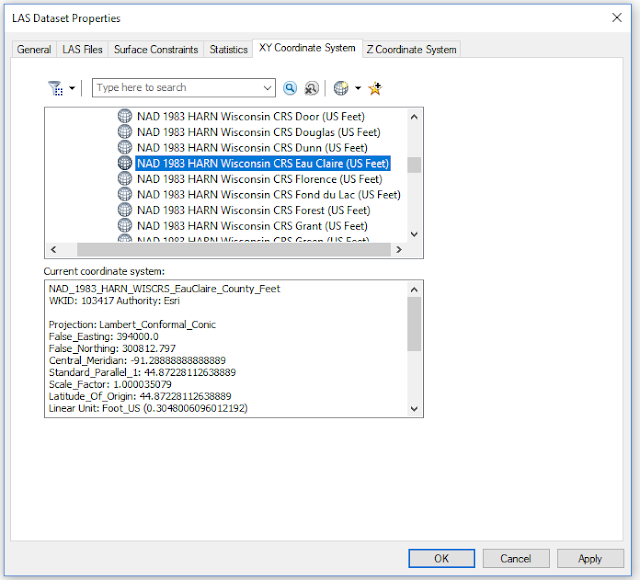 |
| Figure 4: Choose horizontal coordinate system for LAS dataset. |
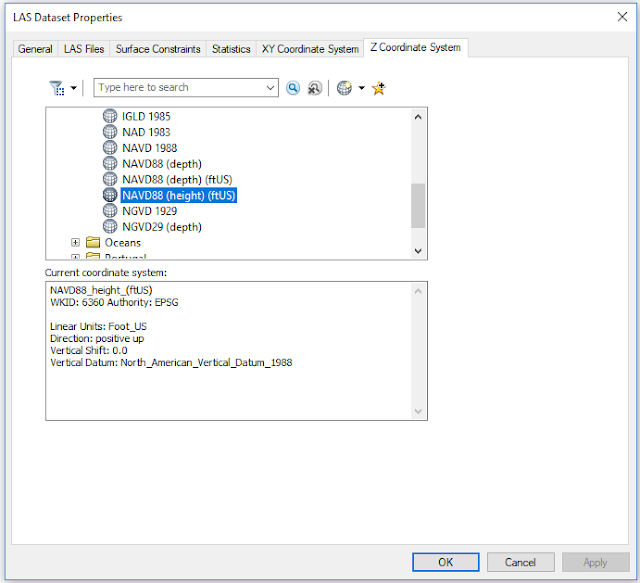 |
| Figure 5: Choose vertical coordinate system for LAS dataset. |
The dataset was then used in ArcMap to visualize the point cloud in various ways. By navigating to the symbology tab within the dataset layer properties, the number of classes, which returns, colors, and other parameters were configured to visualize the dataset for different applications.
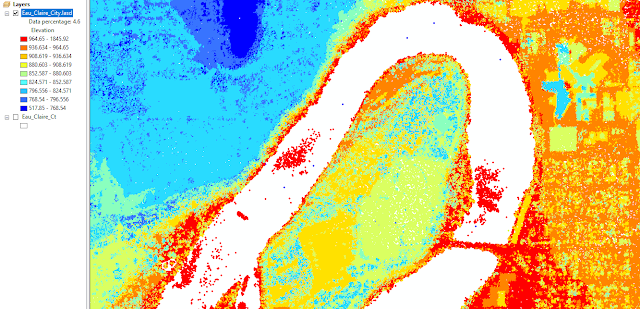 |
| Figure 6: Visualizing the lidar point cloud in ArcMap. |
Using the
LAS Toolbar was helpful in interpreting various components of the dataset. The
profile tool was especially helpful in determining false return points within the point cloud.
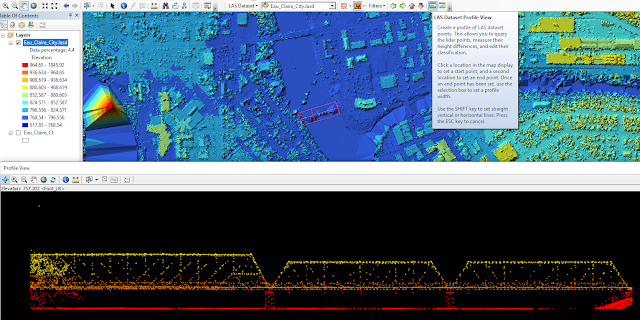 |
| Figure 7: Using the profile tool in ArcMap. |
Next, a
Digital Surface Model,
Digital Terrain Model, and corresponding
Hillshades were created using the dataset. To achieve this, the
LAS Dataset to Raster tool was used, adjusting different components within the prompt to display surface or terrain.
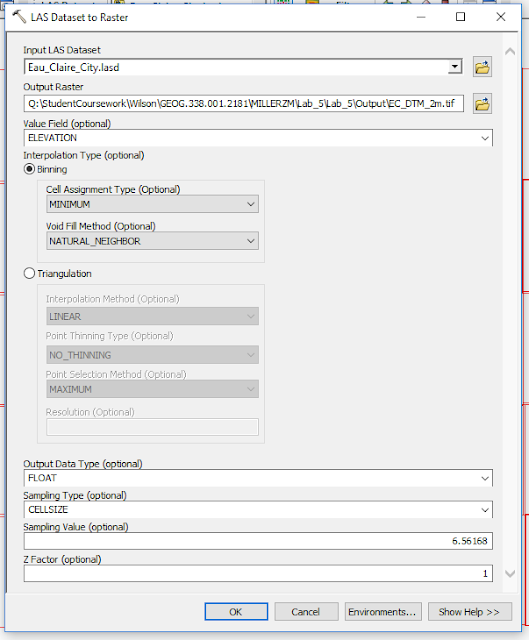 |
| Figure 8: Using LAS Dataset to Raster tool in ArcMap to create a Digital Terrain Model (DTM). |
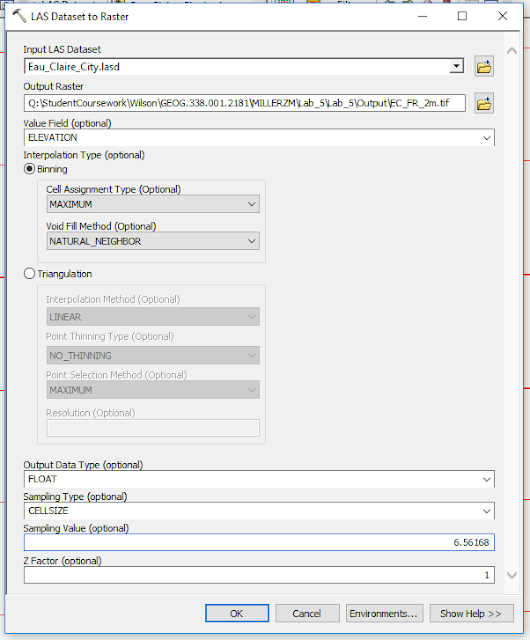 |
| Figure 9: Using LAS Dataset to Raster tool in ArcMap to create a Digital Surface Model (DSM) using the first return of point cloud. |
Lastly, an
Intensity Image was created using the intensity values within the dataset instead of elevation values. The image was then brought into ERDAS Imagine for better visualization.
Results
 |
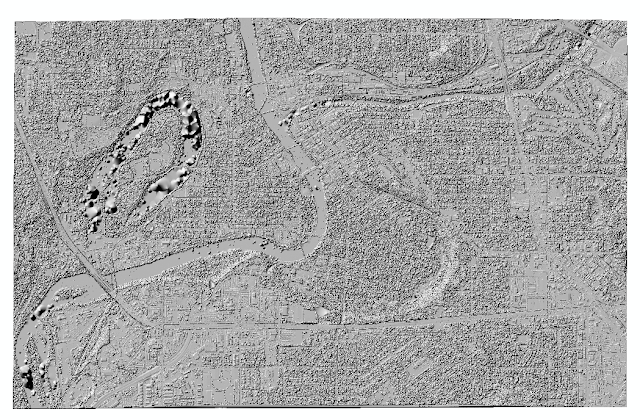
| Figure 10: Digital Surface Model result. |
 |
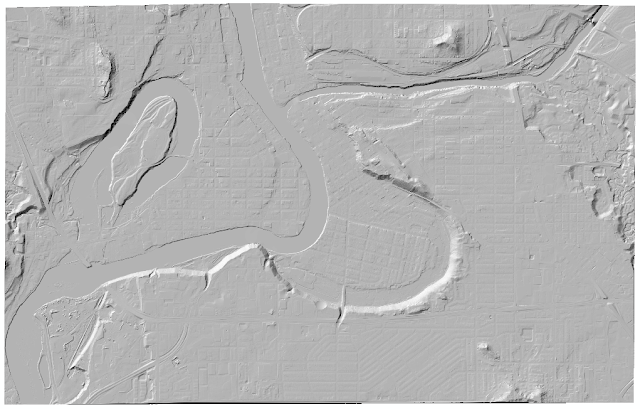
| Figure 11: Digital Terrain Model result. |
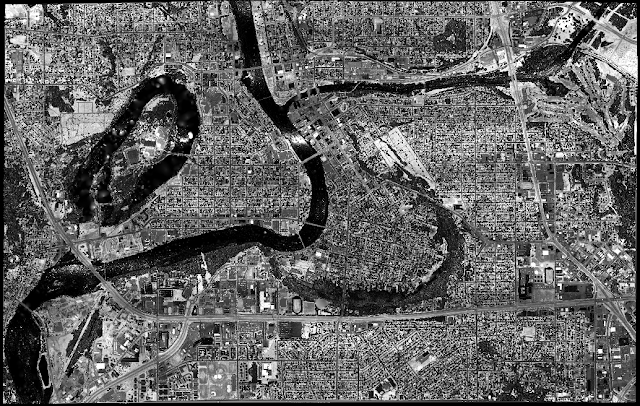 |
| Figure 12: Intensity image result. |
Discussion
I found the lidar visualization skills learned in this assignment were interesting and beneficial. Having never worked with a lidar dataset before this assignment, I now feel more confident in my ability to work with these types of datasets. Of course, this lab covered basic functionalities and visualization techniques for lidar datasets, however, lidar now seems more exciting and useful of a technology for visual interpretation, land use/land cover, and other remote sensing applications than satellite imagery. There are benefits to using either technology and, in some cases, could be used in accordance with one another. LiDAR datasets are indeed more versatile than satellite imagery, due to their Z coordinate values, return layers, and profile viewing capabilites alone- you just can't get that level of 3-dimensional information with satellite imagery.


No comments:
Post a Comment